This guide explains how to view and export the sales and Z reports for your establishments over a selected period.
- Statistics - daily turnover
- Z report - end-of-service closure
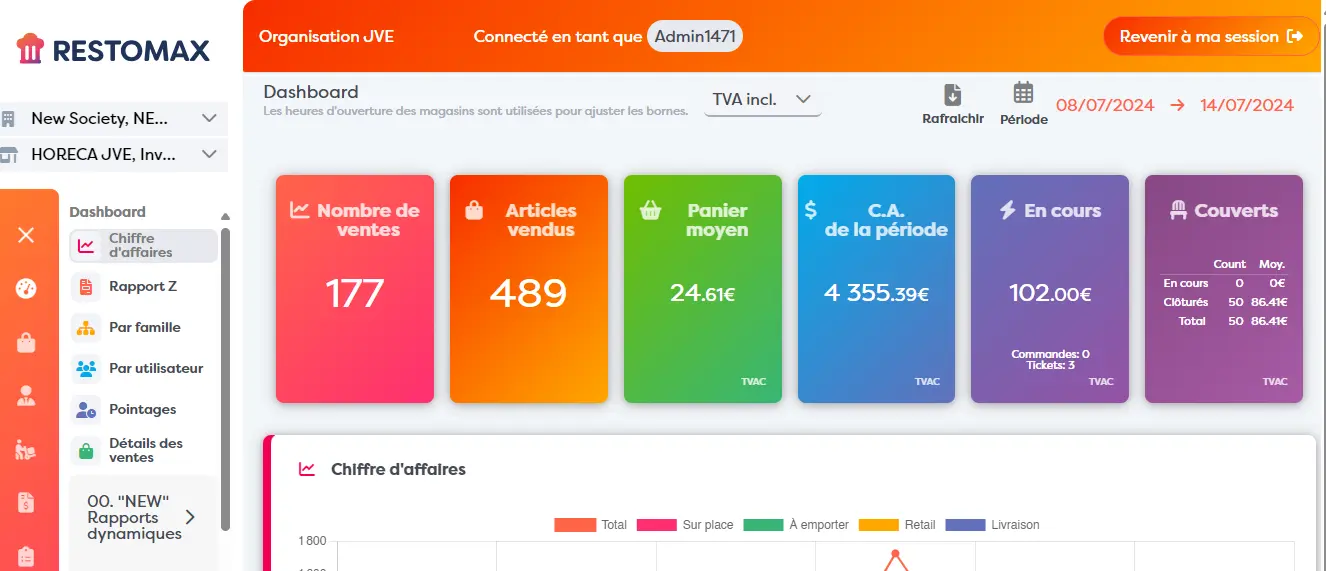
Getting started:
Select the desired entities and blinds on the left; by default, they are all selected.
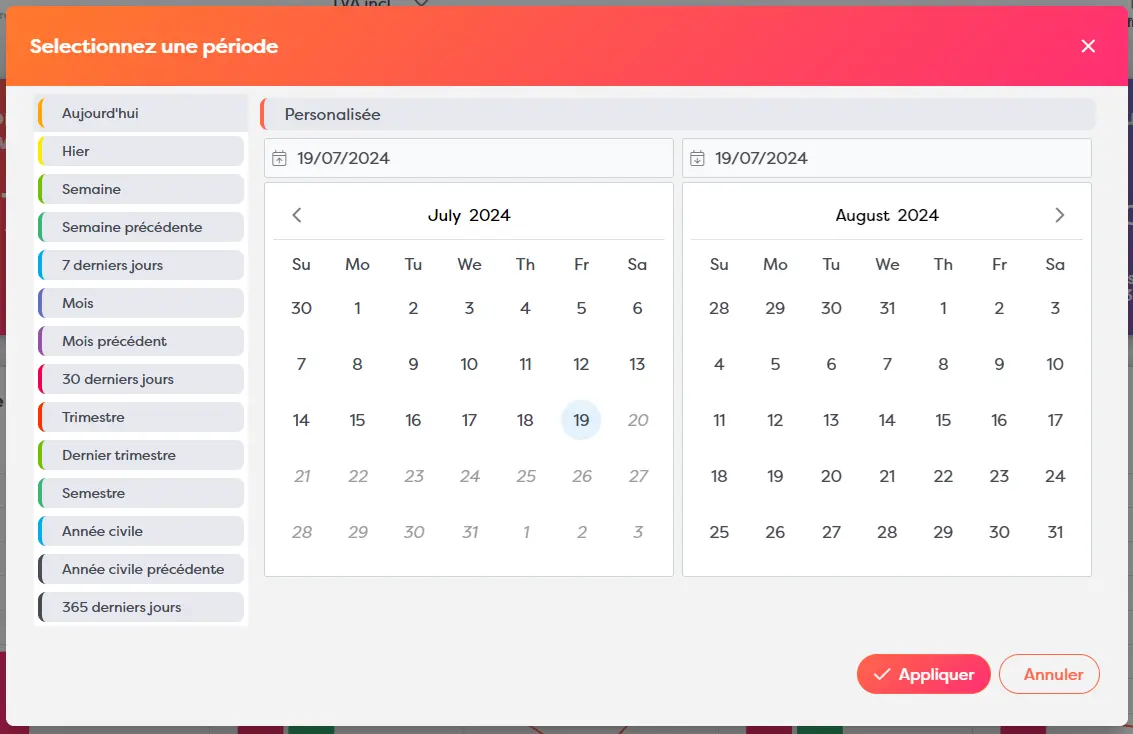
Then select the desired period on the right of the screen, using the period button, which will help you with predefined choices, or by selecting the analysis start and end dates manually.
Helper helps you select the analysis periods:
Statistics - daily turnover
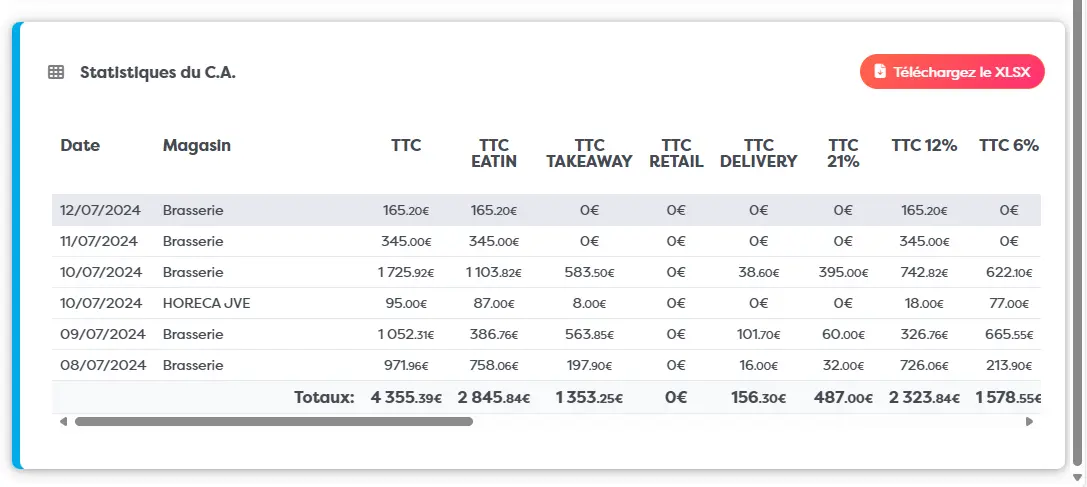
Once you have selected the dates, the results will be recalculated. At the bottom of the page you will find a statistical table showing the breakdown of your daily sales figures with and without tax in different columns, by date and by shop.
A Download button also lets you export the results in Excel table format.
Important: the result in this table corresponds to the figure for the calendar day, not your end-of-service Z report. A sale made after midnight will therefore be totalled on the following day.
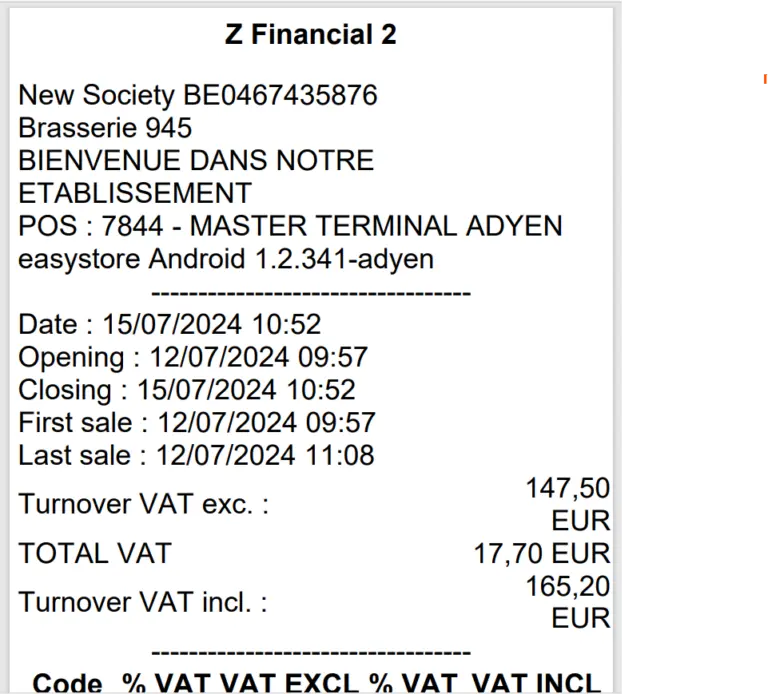
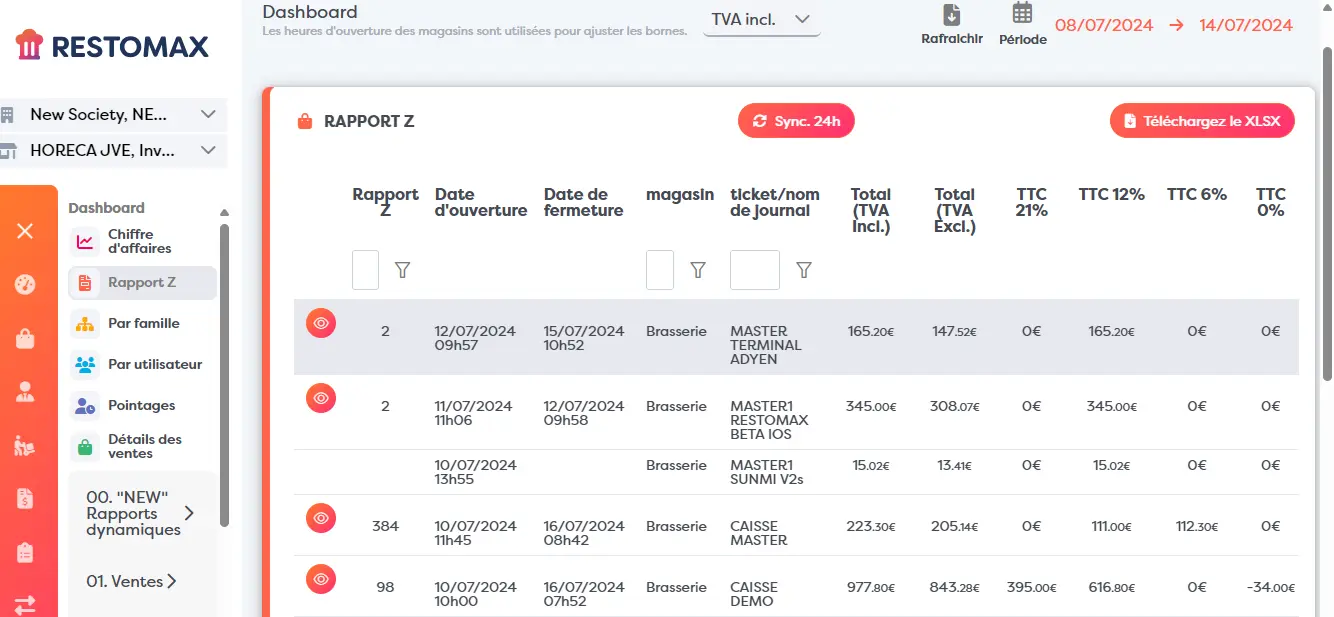
Z report - end-of-service closure
In the Dashboard, a Z Report menu lets you view and export your financial closing reports.
Click on the download button to export the table in Excel format.
The button at the beginning of the line, symbolised by an eye, allows you to view the validated Z report and download it.
Important note: If you do not see an eye, as in line 3 in the example, this means that you have not closed the till. The date columns show how long the till has been open and the ticket/journal column shows the name of the till concerned, in this case MASTER1 BETA IOS.
Example of a Z report: